
Southeast Asia short-term rental statistics 2026 (sourced)
Arrivals, source markets and 2025 Airbnb occupancy and ADR for Vietnam, Indonesia, Bali, Thailand and Malaysia, each with its period and a link to the source.
 Tai Pham
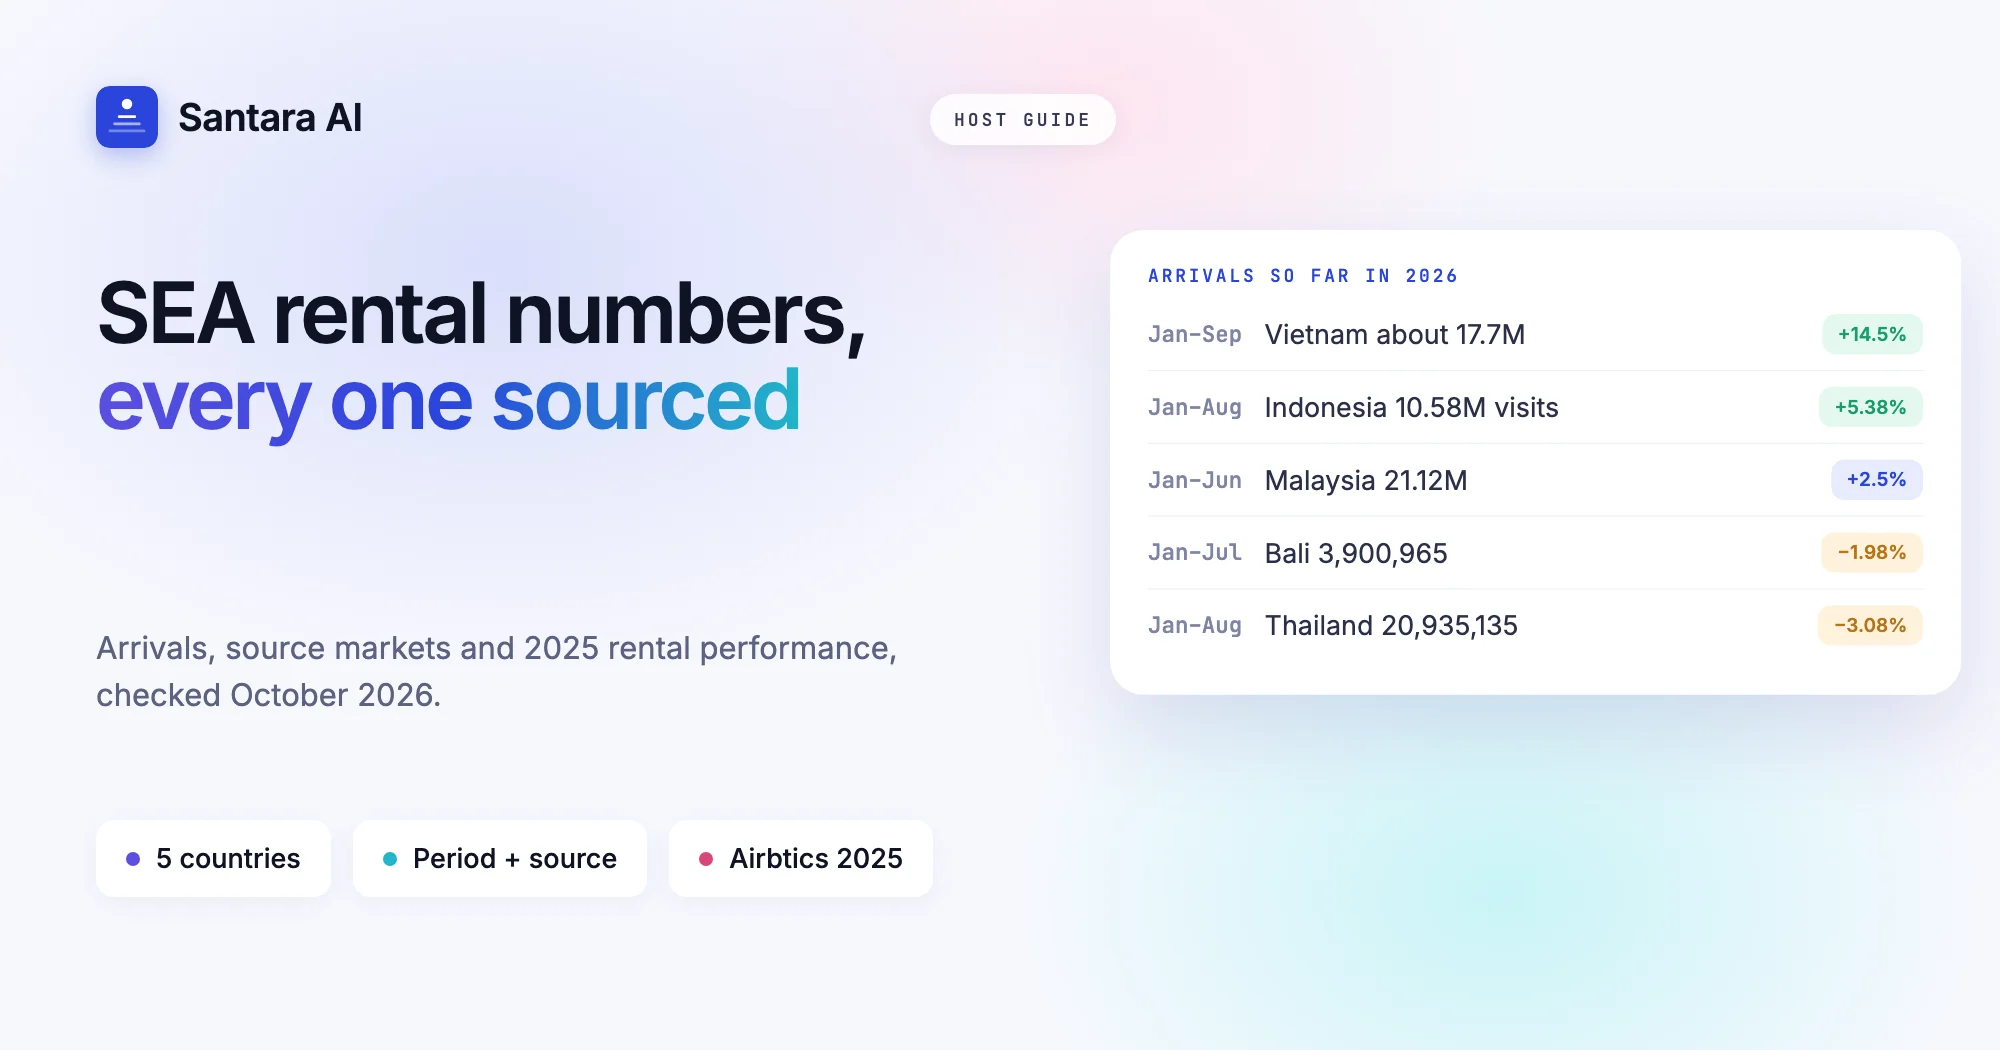
Most posts about Southeast Asia short-term rental statistics repeat the same few numbers with no date and no link. This one does the opposite. Every figure below names who published it, the period it covers, and links to the page. Where we could not find a citable source, the number is left out rather than estimated.
The figures were checked in October 2026. They cover international arrivals for Vietnam, Indonesia (and Bali), Thailand, Malaysia and the Philippines from 2024 to the latest 2026 months, the source markets that matter for each, and 2025 short-term rental performance from one named data provider.
Then comes the part that matters more than the numbers: how a host should read them, and what to change on your own calendar because of them.
Two warnings before the tables
Countries count visitors differently. Vietnam and Thailand report arrivals. Indonesia reports visits. Malaysia's headline count includes day-trippers, as The Star explains. The Philippines publishes totals that include overseas Filipinos. Compare trends within one country, not raw totals across countries.
Rental data firms track different samples. Occupancy and average daily rate (ADR) from one provider will not match another's. All rental figures in this post come from one provider, Airbtics, which tracks Airbnb listings, so they can be compared with each other but not mixed with other firms' numbers.
International arrivals, 2024 to 2026
| Stat | Figure | Period | Source |
| Vietnam international arrivals | ~17.6 million (+39.5%) | 2024 | VOV via DTiNews |
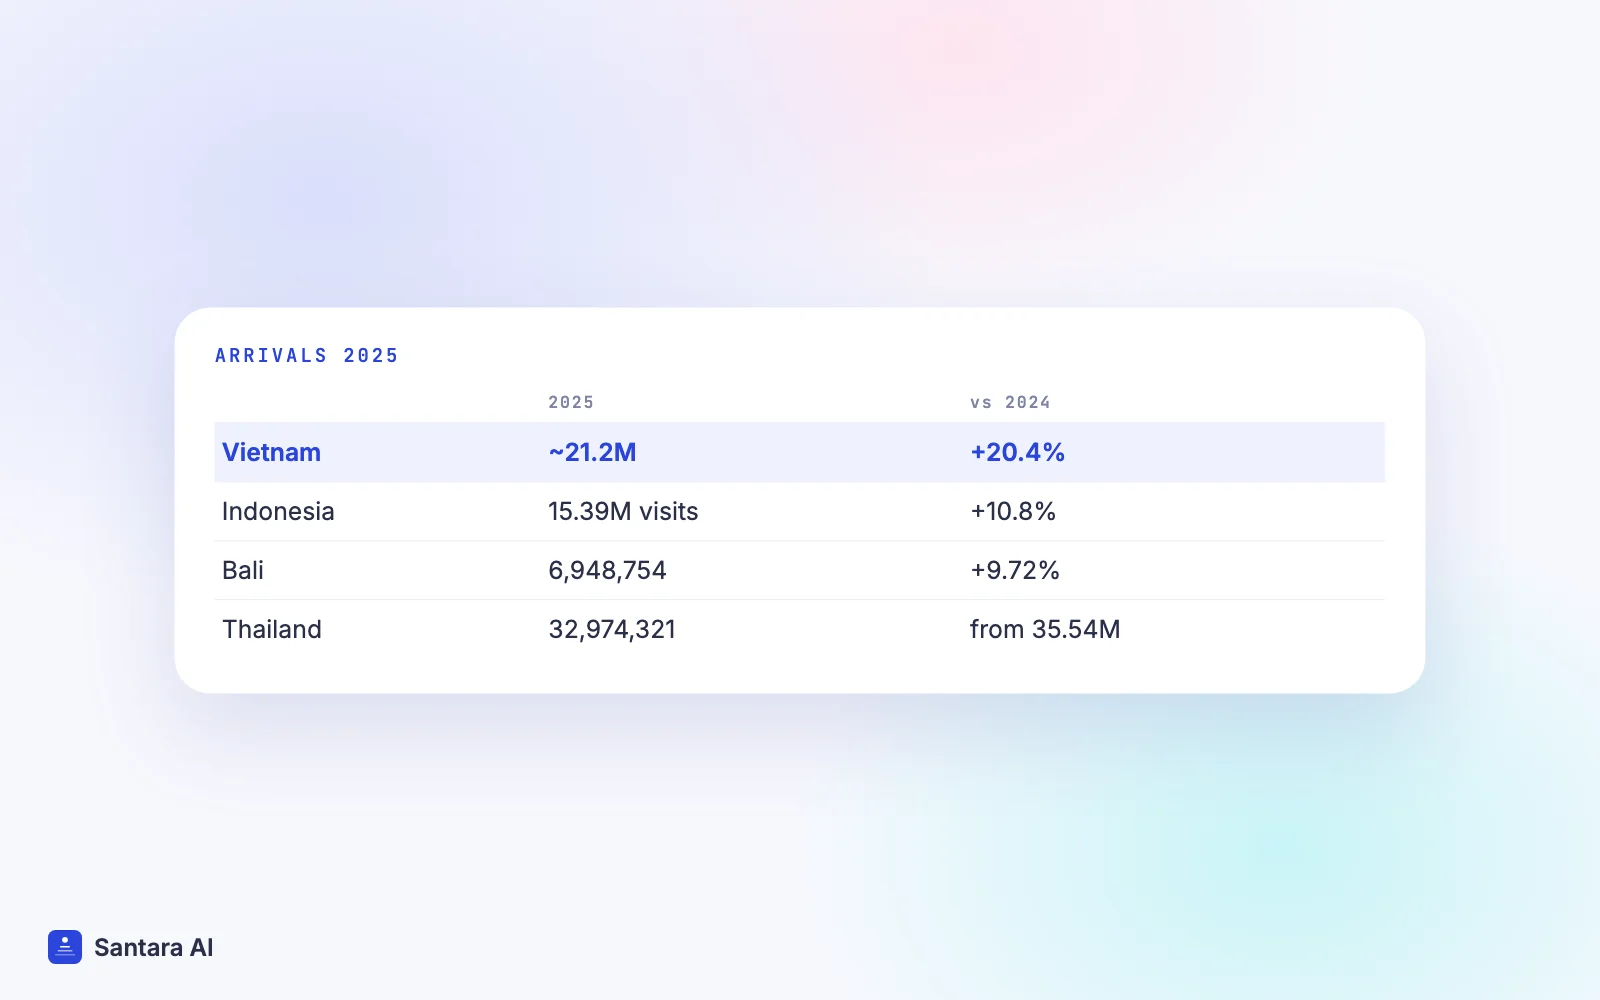
| Vietnam international arrivals | nearly 21.2 million (+20.4%); 84.3% by air | 2025 | NSO Viet Nam |
| Vietnam international arrivals | about 17.7 million (+14.5%) | Jan–Sep 2026 | VietnamPlus |
| Indonesia foreign visits | 13,902,420 (+19.05%) | 2024 | BPS via GoodStats |
| Indonesia foreign visits | 15.39 million (+10.8%) | 2025 | BPS via Bisnis.com |
| Indonesia foreign visits | 10.58 million (+5.38%) | Jan–Aug 2026 | BPS via ANTARA |
| Bali direct foreign arrivals | 6,948,754 (+9.72%) | 2025 | BPS Bali via ANTARA |
| Bali direct foreign arrivals | 3,900,965 (−1.98%) | Jan–Jul 2026 | BPS Bali via ANTARA Bali |
| Thailand foreign arrivals | about 35.54 million (+26.27%) | 2024 | The Financial Express |
| Thailand foreign arrivals | 32,974,321 | 2025 | Ministry of Tourism and Sports via Nation Thailand |
| Thailand foreign arrivals | 20,935,135 (−3.08%) | Jan–Aug 2026 | Nation Thailand |
| Malaysia international arrivals | 21.12 million (+2.5%); ASEAN 72.8% | Jan–Jun 2026 | The Star |
| Philippines visitor arrivals | 6,430,133, incl. 543,009 overseas Filipinos | 2025 | DOT via PhilSTAR Life |
Thailand's 2025 total is about 7% below its 2024 figure (our calculation from the two published numbers). Bali's first seven months of 2026 ran slightly below 2025, while Indonesia as a whole and Vietnam kept growing.
Where the guests come from
| Stat | Figure | Period | Source |
| Vietnam: China / South Korea | 3.9M (22.4%) / 3.0M (17.3%) | Jan–Sep 2026 | VietnamPlus |
| Vietnam: Russia / Taiwan (China) / United States | ~1.1M / 964,000 / 764,000 | Jan–Sep 2026 | VietnamPlus |
| Indonesia: Malaysia / Australia / Singapore | 17.2% / 11.4% / 9.9% of visits | 2025 | BPS via Bisnis.com |
| Bali: Australia / India / China | 1.63M / ~569,260 / ~537,380 | 2025 | ANTARA |
| Bali: Australia's share | 174,539 (25.01%) | Jul 2026 | ANTARA Bali |
| Thailand: Malaysia / China / India | 4,520,856 / 4,473,992 / 2,487,319 | 2025 | Nation Thailand |
| Thailand: China / Malaysia / South Korea | 3,543,272 (+16.05%) / 2,658,686 (−11.87%) / 769,930 (−24.78%) | Jan–Aug 2026 | Nation Thailand |
Two shifts stand out. Russia is now Vietnam's third market, up about 160% in January to September 2026 according to VietnamPlus. And South Korea is falling in Thailand while still second in Vietnam.
Short-term rental performance in 2025
All figures below come from Airbtics' 2025 market reviews, published 22 January 2026. Revenue change and supply growth are year on year.
| Market | Occupancy / ADR | Revenue change / supply | Source |
| Vietnam (national) | 45.33% / VND974,374 | +14.52% / +42.76% | Airbtics Vietnam |
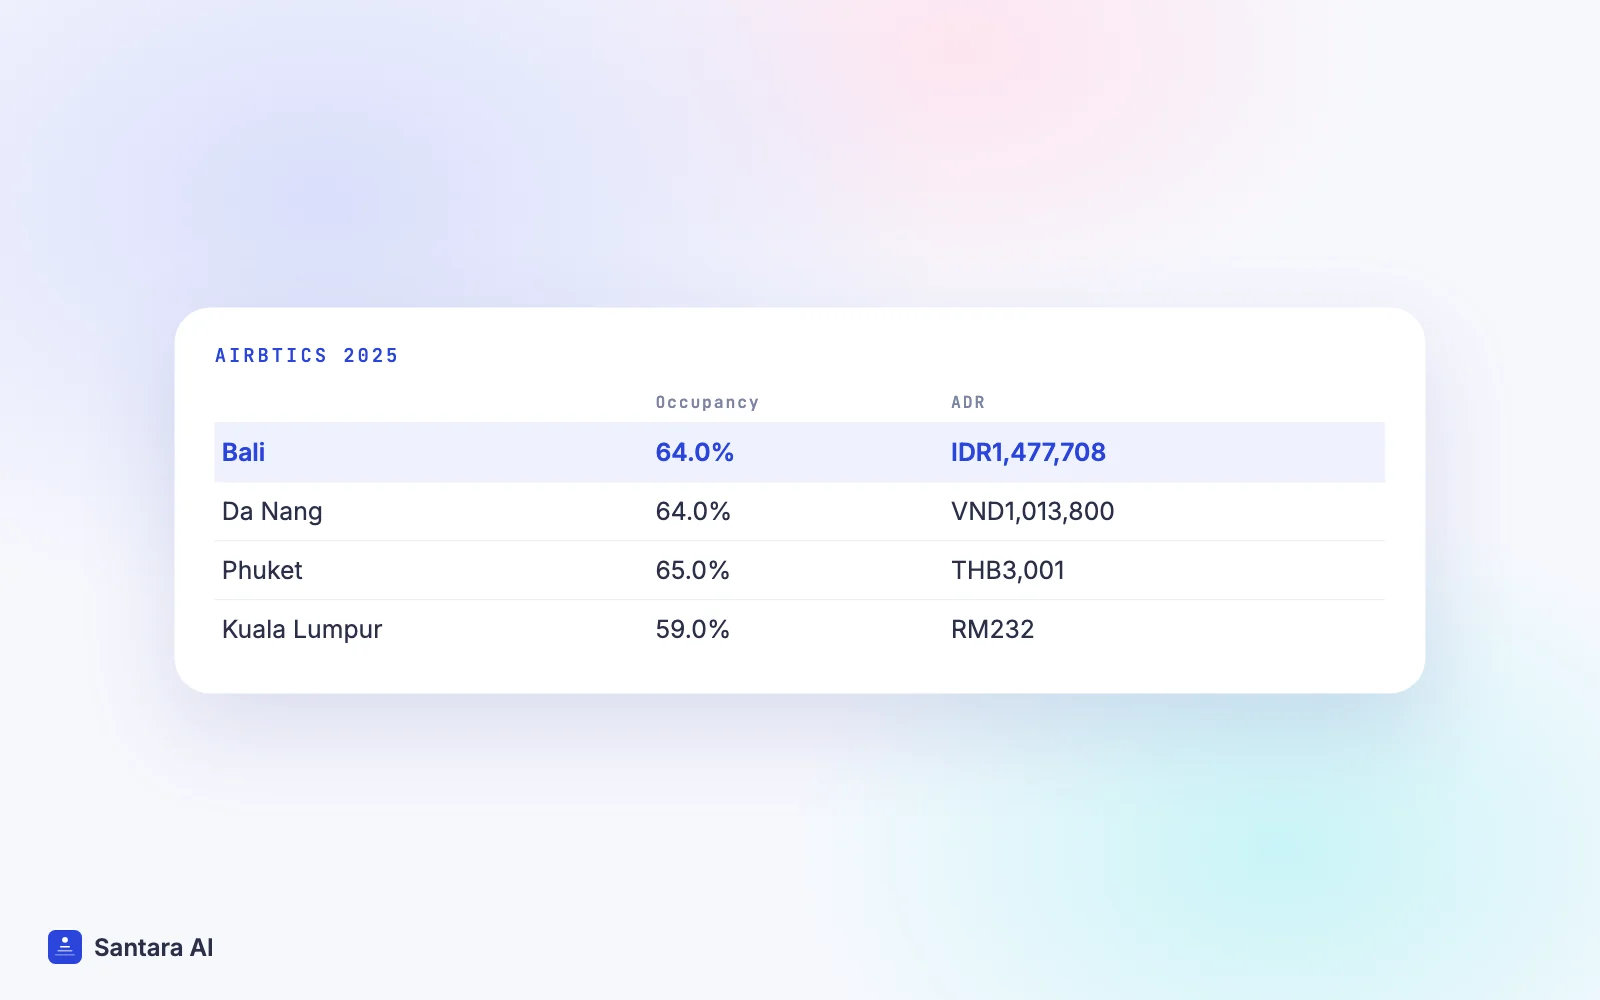
| Da Nang | 64.0% / VND1,013,800 | +24.12% / +51.88% | Airbtics Vietnam |
| Ho Chi Minh City | 53.0% / VND1,140,525 | +8.75% / +37.5% | Airbtics Vietnam |
| Indonesia (national) | 47.57% / IDR832,805 | −0.76% / +32.91% | Airbtics Indonesia |
| Bali | 64.0% / IDR1,477,708 | −10.94% / +8,919 listings | Airbtics Indonesia |
| Thailand (national) | 62.70% / THB2,679 | +18.88% / +32.20% | Airbtics Thailand |
| Phuket | 65.0% / THB3,001 | +22.10% / +3,107 listings | Airbtics Thailand |
| Kuala Lumpur | 59.0% / RM232 | +10.69% / +4,676 listings | Airbtics Malaysia |
For a hotel-side comparison, BPS Bali reported star-hotel occupancy of 67.29% in July 2026 (ANTARA Bali). Hotels and rentals are measured differently, so treat it as context, not a benchmark.
What Southeast Asia short-term rental statistics say for hosts
Supply is the story in 2025. In every national market Airbtics covers, listings grew by between about 25% and 43% in a year. In Bali, arrivals rose almost 10% but revenue per listing fell almost 11%, because thousands of new listings shared the demand. Da Nang and Phuket show the opposite: supply grew, yet revenue still rose.
Source markets shift within a single year. Malaysia, China and Australia lead in different places, and South Korea is up in one country and down in another. A listing written for one nationality can lose ground quickly.
There is no reliable public figure for booking share by OTA. We could not find a primary source for the percentage of short-term rental bookings by channel in Southeast Asia, so we do not quote one. Treat any number you see without a link with care.
How to use these statistics on your own listing
Step 1
Pick one data provider and stick to it
Compare your own occupancy and ADR against one provider's figures for your market, every quarter. Mixing providers gives you a gap that may not exist.
Step 2
Count your nights the same way
Leave owner stays and blocked maintenance nights out of your occupancy, or your numbers will not line up with the market figures.
Step 3
Match the listing to the growing markets
If Chinese, Russian or Indian guests are rising in your area, check that your photos, house rules and replies make sense to them.
Step 4
Compete on more than price when supply rises
New listings arrive with low prices. Reviews, quick replies and a calendar that is never wrong hold up better than another discount.
Step 5
Recheck after the year-end figures
Statistics offices publish full-year figures in early January or February. Put a reminder in your calendar to refresh your plan then.
If you sell on several sites, it also helps to know what each one keeps from a booking; see Airbnb vs Booking.com fees for hosts.
How Santara AI helps when supply keeps growing
Santara AI does not publish market statistics or benchmark your listing against them. What it does is the operational side that matters more in a crowded market.
Each room has one calendar, and up to 54 connected channels are fed from it, including Airbnb, Booking.com, Agoda, Traveloka, Tiket.com, Expedia and Trip.com. Bookings, changes and cancellations from every connected channel land on that calendar, so a booking on one channel lowers availability on the others. A first-party smart pricing rule engine can set prices for seasons, weekends, last-minute dates and gaps, and your manual edits are protected from being overwritten by the rules. Guest messages from Airbnb, Booking.com and Expedia arrive in one inbox with AI-drafted replies that send only when you press Send.
What it doesn't do
Santara AI does not import market data from Airbtics or any other provider, and it does not calculate market occupancy. It does not set different prices per channel.
FAQ
How many tourists visited Southeast Asia in 2025?
There is no single comparable total, because countries count differently. Vietnam reported nearly 21.2 million arrivals, Indonesia 15.39 million visits, Thailand 32,974,321 arrivals and Bali 6,948,754 direct foreign arrivals.
What is the average Airbnb occupancy in Bali?
Airbtics reported 64.0% occupancy and an ADR of IDR1,477,708 for Bali in 2025, with revenue per listing down 10.94% as 8,919 new listings were added.
Is the short-term rental market in Vietnam growing?
Arrivals are: about 17.7 million in January to September 2026, up 14.5%. Airbtics reported 2025 revenue up 14.52% nationally, while supply grew 42.76%.
Which OTA has the most bookings in Southeast Asia?
We found no public primary source with OTA booking shares for short-term rentals in the region. Check your own reservation reports by channel instead.
Keep reading
- Best vacation rental software in Southeast Asia 2026
- Sync prices and minimum stay across channels
- A multilingual vacation rental website for international guests
Your first 3 months are free.
Join For Free