
How much can an Airbnb earn? Estimate your vacation rental revenue
A step-by-step way to estimate how much an Airbnb can earn: ADR and occupancy per season from comparables, channel fees, and a low case. Worked example, no made-up averages.
 Tai Pham

How much can an Airbnb earn? Nobody can give you one honest number for your place. Its yearly revenue is the nights you sell multiplied by the average price of those nights (ADR), minus channel fees, and both inputs change by season, size, location and reviews. You can estimate it in an afternoon: find the ADR and occupancy of comparable listings for each season, multiply, subtract fees, then test the result against a low case.
This guide shows that method step by step, with the free tools the platforms give you, the published market data that exists for Southeast Asia, and one worked example. Every number in the example is hypothetical. The only real figures in this post are the platform rules and the market data, each linked to its source and checked as of November 2026.
How do you estimate how much an Airbnb can earn?
Use one formula, and run it per season, not per year:
| Line | Formula |
| Nights available | Units × nights in the season |
| Nights sold | Nights available × occupancy |
| Gross room revenue | Nights sold × ADR |
| Revenue after channel fees | Gross room revenue − channel fees |
| What you keep | Revenue after fees − costs and tax (see the profit worksheet) |
If ADR, occupancy or RevPAR are new terms, our guide to occupancy, ADR and RevPAR defines each one. The rest of this post is about the hard part: choosing honest inputs.
Step 1
Define what you are selling
Write down bedrooms, maximum guests, whether you sell the whole place or separate rooms, and how many identical units you have. Two identical rooms are two units, and they double your nights available.
Step 2
Split the year into seasons
Use three or four seasons that match your area: peak, shoulder, low. Holidays such as Christmas, Tết or Lebaran often deserve their own short season.
Step 3
Find ADR per season from comparables
Look at what similar places actually got booked at, not what they ask. The next section shows where to look.
Step 4
Find occupancy per season
Use your comparables' calendars, the platform's own estimate, or a named data provider, and write down which.
Step 5
Multiply, then subtract fees
Nights sold × ADR per season, add the seasons together, then take off each channel's fee.
Step 6
Run a low case
Cut occupancy by 10 points and ADR by 10%. If the low case doesn't work for you, the plan doesn't either.
Where do you find honest ADR and occupancy numbers?
There are three useful sources, and each has a bias you should know about.
1. Airbnb's own earnings estimate. Airbnb explains how the estimate on its hosting page works in How we estimate your earning potential. It looks at the past 12 months of booking data from similar Airbnb listings, chosen from the details you enter. Three details matter for planning:
- If you enter an area instead of an address, Airbnb looks at "the top 50% of similar listings in that area, based on their earnings". That is the better half of the market, not the middle of it.
- Nightly earnings are the host's price minus Airbnb's host service fee, so the number is already after Airbnb's fee.
- Airbnb says it does not subtract taxes or hosting expenses, and that the estimate is not an appraisal of property value.
Use it as a ceiling, not as a forecast.
2. Airbnb's similar listings map. Once you have a listing, the similar listings tool in the Pricing tab of your calendar shows average prices of similar listings nearby for a date range of up to 31 days. You can switch between booked and unbooked listings. Airbnb says similarity is based on location, size, features, amenities, ratings and reviews. Use the booked prices for your ADR: unbooked prices are what hosts ask and nobody has paid yet. Do it once per season, because 31 days is the maximum range.
Before you have a listing, do the same by hand: search Airbnb, Booking.com and Agoda as a guest for your dates, note 8 to 10 places like yours, and check their calendars a few weeks ahead to see how full they are. It is rough, but it is your market, not an average.
3. Market data from a named provider. Our Southeast Asia short-term rental statistics post collects published figures. The rental figures there come from Airbtics, a data firm that estimates performance from listing calendars. Its 2025 reports (published 22 January 2026) give, for example:
| Market (2025) | Occupancy | ADR | Avg annual revenue per listing | Source |
| Vietnam (national) | 45.33% | VND974,374 | VND165,063,536 | Airbtics Vietnam |
| Da Nang | 64.0% | VND1,013,800 | VND239,256,800 | Airbtics Vietnam |
| Bali | 64.0% | IDR1,477,708 | IDR348,592,952 | Airbtics Indonesia |
| Indonesia (national) | 47.57% | IDR832,805 | IDR157,687,919 | Airbtics Indonesia |
Airbtics says its metrics are "estimated from historical booking calendars, listing activity, and proprietary aggregation models", and it does not say what its ADR includes. These are averages across every kind of listing, from studios to five-bedroom villas, so use them to sanity-check your occupancy, not as your revenue. Also note the trend: Airbtics reports Bali revenue per listing down 10.94% in 2025 while 8,919 listings were added. In a market with fast supply growth, last year's occupancy is an optimistic input.
A worked example: one apartment, three seasons
Say you plan to list a one-bedroom apartment in Da Nang on Airbnb. All prices and occupancy rates below are hypothetical and the season split is ours; use your own comparables.
| Season | Nights available | Occupancy | Nights sold | ADR | Gross revenue |
| Peak | 92 | 75% | 69 | $55 | $3,795 |
| Shoulder | 151 | 60% | 91 | $45 | $4,095 |
| Low | 122 | 40% | 49 | $38 | $1,862 |
| Year | 365 | 57.3% | 209 | $46.66 | $9,752 |
Notice two things. The year's ADR ($46.66) is not the average of the three prices, because more nights sell in the expensive season. And the yearly occupancy (57.3%) sits a little under Airbtics' 64.0% for Da Nang, which is the right side to err on for a new listing with no reviews yet.
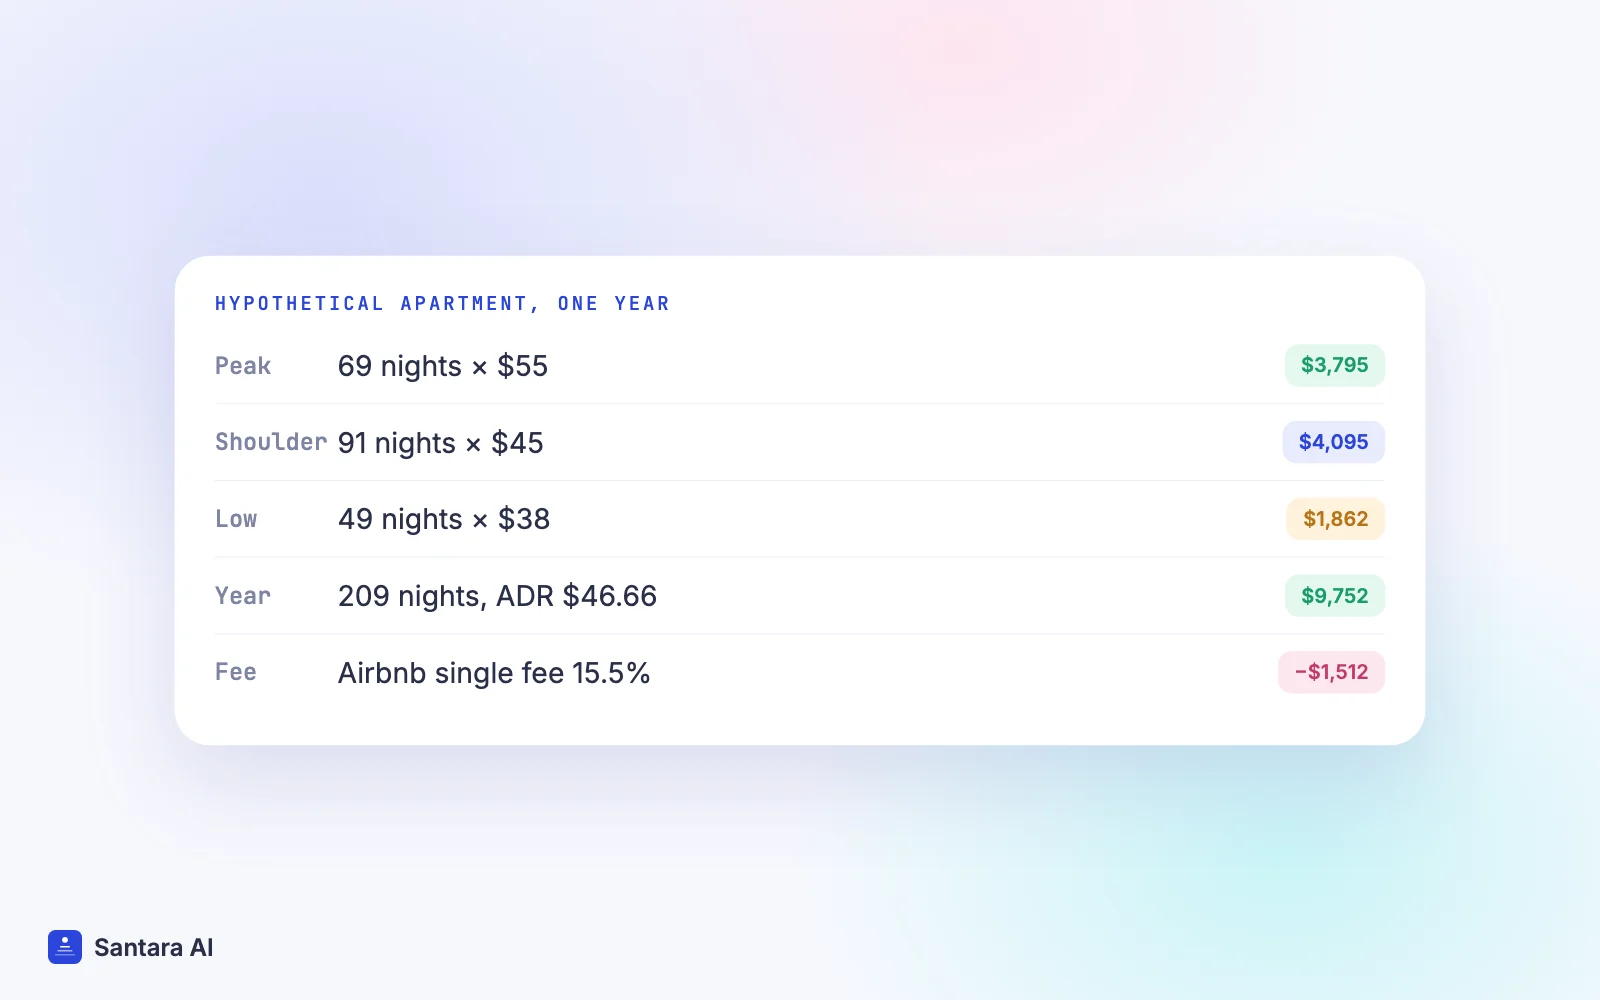
Now take off the channel fee. If every booking came through Airbnb on its single fee, Airbnb says most hosts pay 15.5% (others typically 14% to 16%). That is $9,752 × 15.5% = $1,512, leaving $8,240 before cleaning, utilities, staff and tax. Booking.com and Agoda set the rate in your own contract; our Airbnb vs Booking.com fees guide explains each, and the OTA fee calculator shows what you keep per booking.
Cleaning fees paid by guests are left out on purpose. They pay for cleaning, so count them on both sides of your worksheet or on neither.
How sensitive is the estimate?
Small changes in your inputs move the result a lot. Here is the same apartment with occupancy 10 points lower or higher (about 37 nights a year) and ADR 10% lower or higher. Gross yearly revenue, before fees:
| ADR \ Occupancy | 47% (172 nights) | 57% (209 nights) | 67% (246 nights) |
| $42.00 (−10%) | $7,224 | $8,778 | $10,332 |
| $46.66 (base) | $8,026 | $9,752 | $11,478 |
| $51.33 (+10%) | $8,829 | $10,728 | $12,627 |
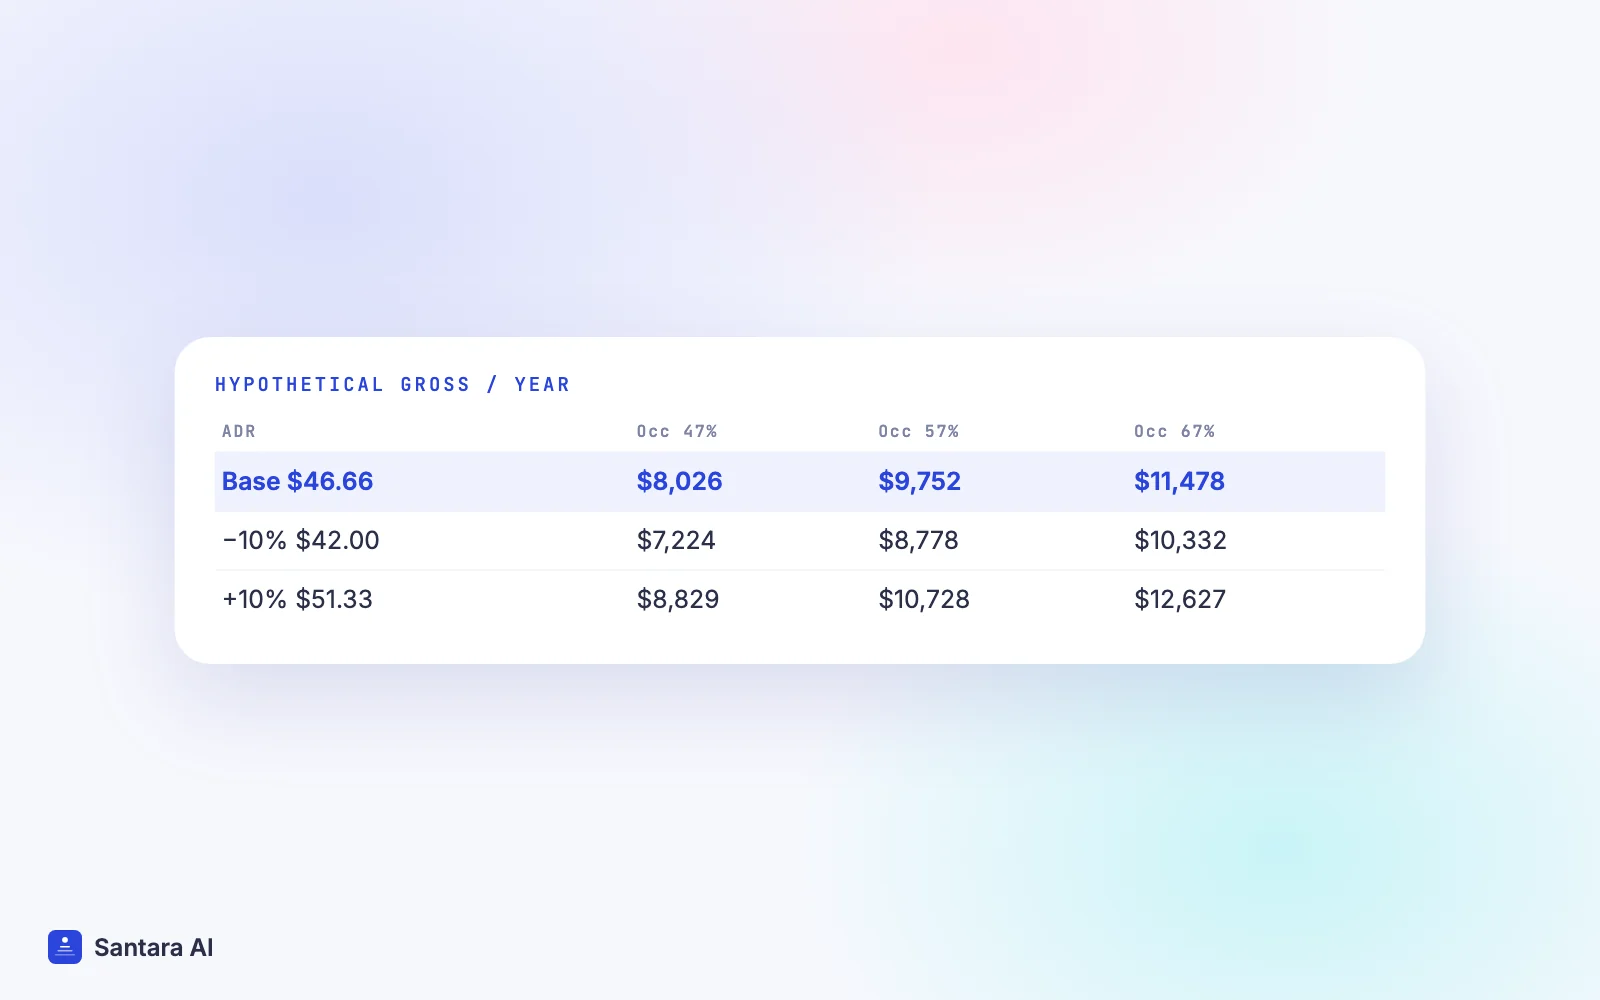
The low corner ($7,224) is 26% below the base, and the high corner ($12,627) is 29% above it. That spread is normal for a first-year estimate. Plan your costs, loan and lease around the low column, and treat the high column as upside.
Why do real numbers miss the estimate?
- The first months are slower. A new listing has no reviews. We found no official figure for how long it takes to catch up, so put your first season in the low column.
- Blocked nights. Owner stays, repairs and personal use reduce nights available. Airbnb's occupancy and rates help reports nights blocked separately for this reason.
- Unit count. One listing with two identical rooms has double the nights available. Count them correctly or your occupancy can pass 100%.
- Season edges move. Holiday dates shift every year; see our Tết and Lebaran pricing guide for 2027.
- Price is a choice. The ADR you get depends on how you price; our guide on how to price your Airbnb covers that, and the low season playbook covers the quiet months.
How Santara AI helps once you are running
Santara AI does not estimate earnings for a place you don't run yet, and it does not import market data. Its job starts when you open: it gives you the actual numbers to compare with your estimate.
Santara AI replaces both the PMS and the channel manager. Each room has one calendar that feeds Airbnb, Booking.com, Agoda, Expedia, Trip.com and the rest of 54 channels, and bookings, changes and cancellations from every connected channel land on it. Each room has a unit count, so nights available are counted the same way you counted them in your plan. A first-party smart pricing rule engine can set prices for seasons, weekends, last-minute dates and gaps, and your manual edits are protected from being overwritten.
The Reports screen shows one monthly statement per property: gross booking revenue, minus channel fees, minus the expenses you add, equals the owner's net. Revenue is recorded as the net payout and counted at checkout, currencies are never converted, and you can download it as CSV to put next to your estimate.
What Santara AI doesn't do here
No revenue forecasts, no market benchmarks, no comparison with other properties, and no tax or management-fee calculation. The estimate is yours; Santara AI shows what actually happened.
FAQ
How much can an Airbnb earn per month?
It depends on your nights sold and ADR in that month, so there is no single figure. Estimate it per season: nights available × occupancy × ADR, minus channel fees. A peak month and a low month at the same place can differ by half or more.
Is Airbnb's earnings estimate accurate?
It is a ceiling, not a forecast. Airbnb says it uses 12 months of data from similar listings, uses the top 50% by earnings when you enter an area, subtracts its host fee and does not subtract taxes or expenses.
What occupancy rate should I assume for a new vacation rental?
Start below the market figure for your area and below your comparables, because a new listing has no reviews. Then test 10 points lower. Airbtics reported 45.33% for Vietnam and 47.57% for Indonesia in 2025, both as national averages.
Should I use gross or net revenue in my estimate?
Calculate gross first (nights sold × ADR), then subtract each channel's fee to get what reaches you. Write down which one you mean every time, because platforms report them differently.
Are cleaning fees part of Airbnb revenue?
Keep them out of ADR. They are paid by guests to cover cleaning, so add them to income and the cleaning cost to expenses in the same worksheet.
Keep reading
Your first 3 months are free.
Join For Free